Building Real-Time Charts from Google Sheets: My Client-Side Scraping Approach
My client needed interactive, country-specific data charts embedded across their site. Rather than querying the server or paying for APIs, I built a client-side scraper to fetch data directly from Google Sheets in real-time.
Hook: The Data Problem
My client ran a business that needed interactive charts showing country-specific metrics on multiple pages across their site. The data changed regularly, so the charts needed to display current information. The obvious solutions had drawbacks: querying the server for each page would increase server load, and paying for Google's official APIs seemed unnecessary for what should be a simple problem.
They already maintained a Google Spreadsheet shared with subscribers as their source of truth for this data. Using that spreadsheet as the chart data source made sense. It eliminated duplicate data maintenance and kept everything synchronized automatically.
My challenge was building a solution that worked smoothly, updated in real-time, and didn't strain their infrastructure.
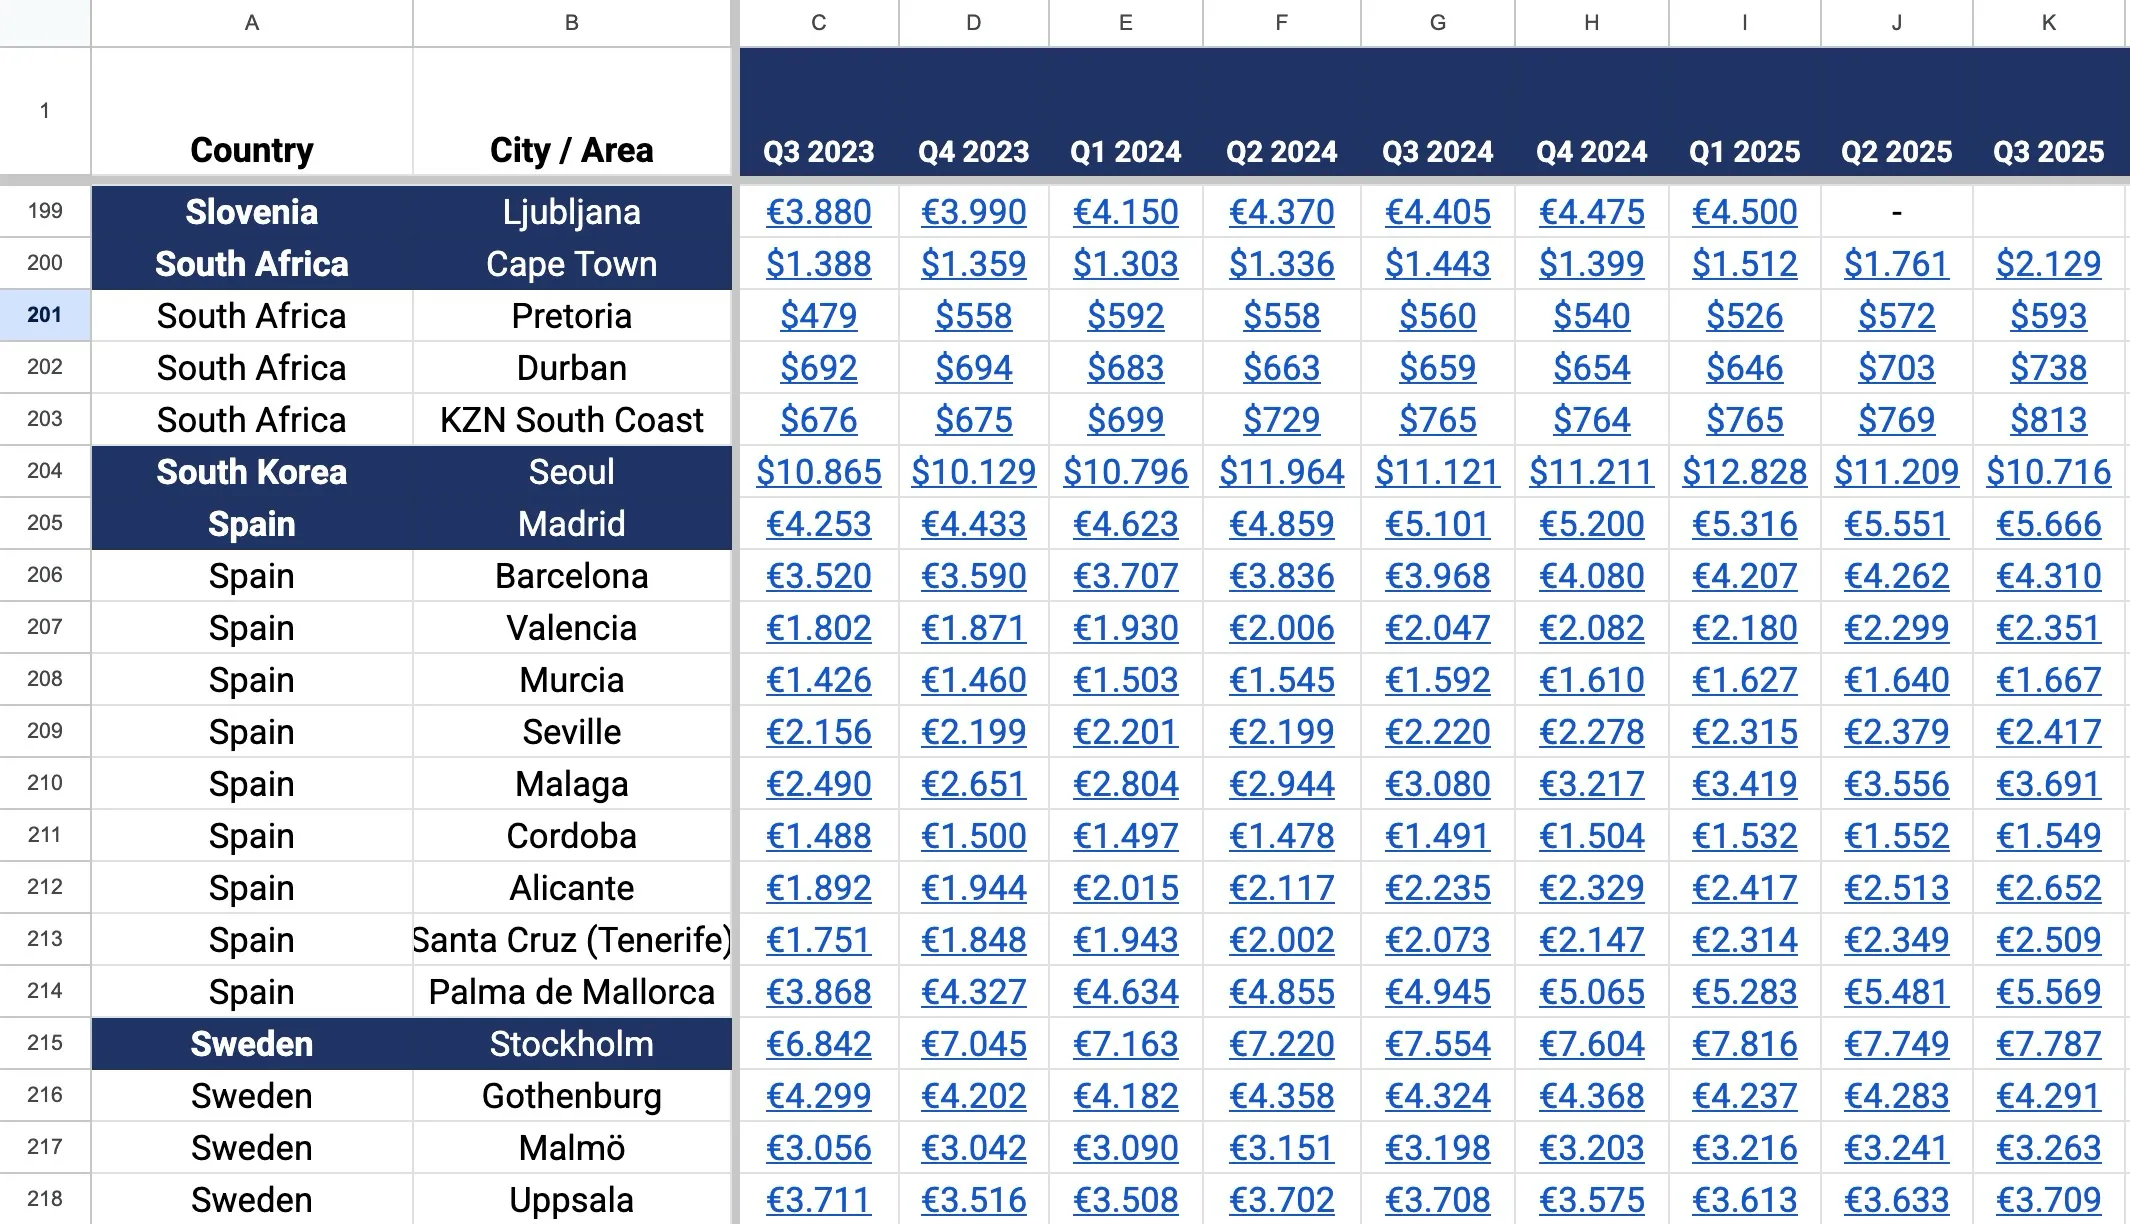
Spreadsheet sample data
✅ Key Takeaway: The best technical solutions often avoid premium services by leveraging tools already in use. Google Sheets can be a data backend if you're willing to scrape it client-side.
The Challenge
Streaming country-specific data to the browser seemed straightforward, but the practical constraints made it complex. Loading the full dataset from the server on every page request would increase their server processing and bandwidth costs, especially with growing traffic.
Caching provided a partial solution but came with its own problems. Cached data becomes stale quickly when source information changes frequently. My client would see outdated charts unless the cache was frequently invalidated, which defeated the efficiency purpose. The timing of cache updates becomes a guessing game. Refresh too often and you've eliminated the benefit; refresh too seldom and users see old information.
The Google Sheets API offered reliability but came with cost concerns. Depending on traffic volume, API fees could accumulate. For a straightforward data visualization project, paying per request felt inefficient.
I needed to build a solution with three qualities: real-time accuracy (always current data), minimal server load (no per-request queries), and no subscription costs (free or very cheap).
Architecture Comparison: Server-Side vs. Client-Side Data Loading
| Factor | Server-Side Loading | Client-Side Scraping |
|---|---|---|
| Server Load | Increases with traffic | Zero impact |
| Data Freshness | Depends on cache strategy | Always current |
| API Costs | Recurring fees per request | Free |
| User Privacy | Server sees all data requests | Client-side only |
| Implementation Speed | Requires backend setup | Client-side JavaScript only |
| Scalability | Limited by server resources | Unlimited |
| Data Security | Centralized control | Data public as CSV |
| Failure Mode | Server down = broken charts | Individual chart fails gracefully |
My Approach and Solution
I took a purposefully unconventional route: client-side scraping of the Google Spreadsheet.

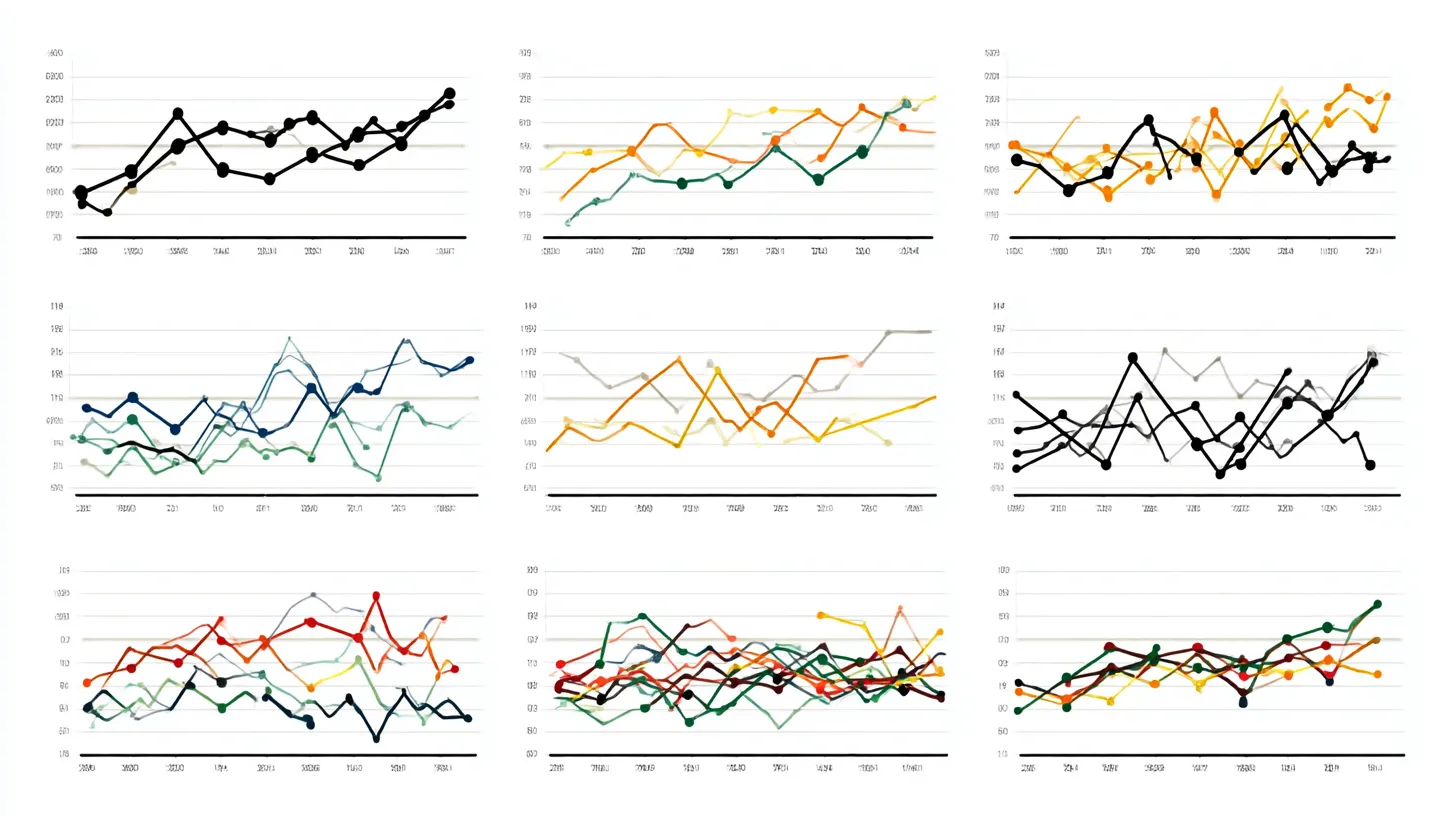
Observable Plot JS Library
💡 Pro Tip: Google Sheets public CSV export is free and fast. It's not an undocumented API exploit. Google officially supports CSV exports for public sheets. This is a legitimate approach for public data visualization.
Google Sheets as Data Source. Rather than building a database and maintaining duplicate data, I used the spreadsheet itself. My client already managed it for business purposes; it became the single source of truth. Google Sheets is free, already shared with stakeholders, and has a version history, so nothing was lost.
JavaScript-Based Scraper. I built a lightweight JavaScript scraper that runs entirely in the browser, not on the server. When a user loads a page with a chart, the JavaScript fetches the spreadsheet data directly from Google's public CSV export, parses it, and passes it to the charting library. This approach has several advantages: it's free (no API costs), it doesn't require authentication, and it distributes the computational load to browsers instead of concentrating it on the server.
Observable Plot for Visualization. I chose Observable Plot, a modern data visualization library with a clean API and excellent performance. It handles rendering interactive, responsive charts that work across devices without the bloat of heavier charting libraries.
Real-Time Data Flow. The solution fetches fresh data from the spreadsheet each time a page loads. There's no caching layer, so users always see current information. The data reflects whatever is currently in the spreadsheet, updated within seconds of any changes.
Embeddable Everywhere. Because the scraper runs client-side and doesn't require server-side processing, the same chart code embeds anywhere on the site. A single code snippet produces interactive charts with current data on every page, from the homepage to detail pages to promotional sections.
Implementation Checklist for Google Sheets Data Visualization
- Make Google Sheet publicly shareable (no authentication needed)
- Get the CSV export URL from the spreadsheet
- Write JavaScript to fetch CSV and parse data
- Choose visualization library (Observable Plot, Chart.js, etc.)
- Implement data transformation from CSV to chart format
- Add error handling if data fetch fails
- Optimize async loading to not block page render
- Test chart rendering on different screen sizes
- Monitor browser console for data loading errors
- Create code snippet for easy embedding across site
Performance Optimization. I optimized the scraper to fetch only required columns and rows, minimizing data transfer. The JavaScript runs asynchronously, so it doesn't block page rendering. Charts fade in once data arrives, creating a smooth user experience even on slower connections.
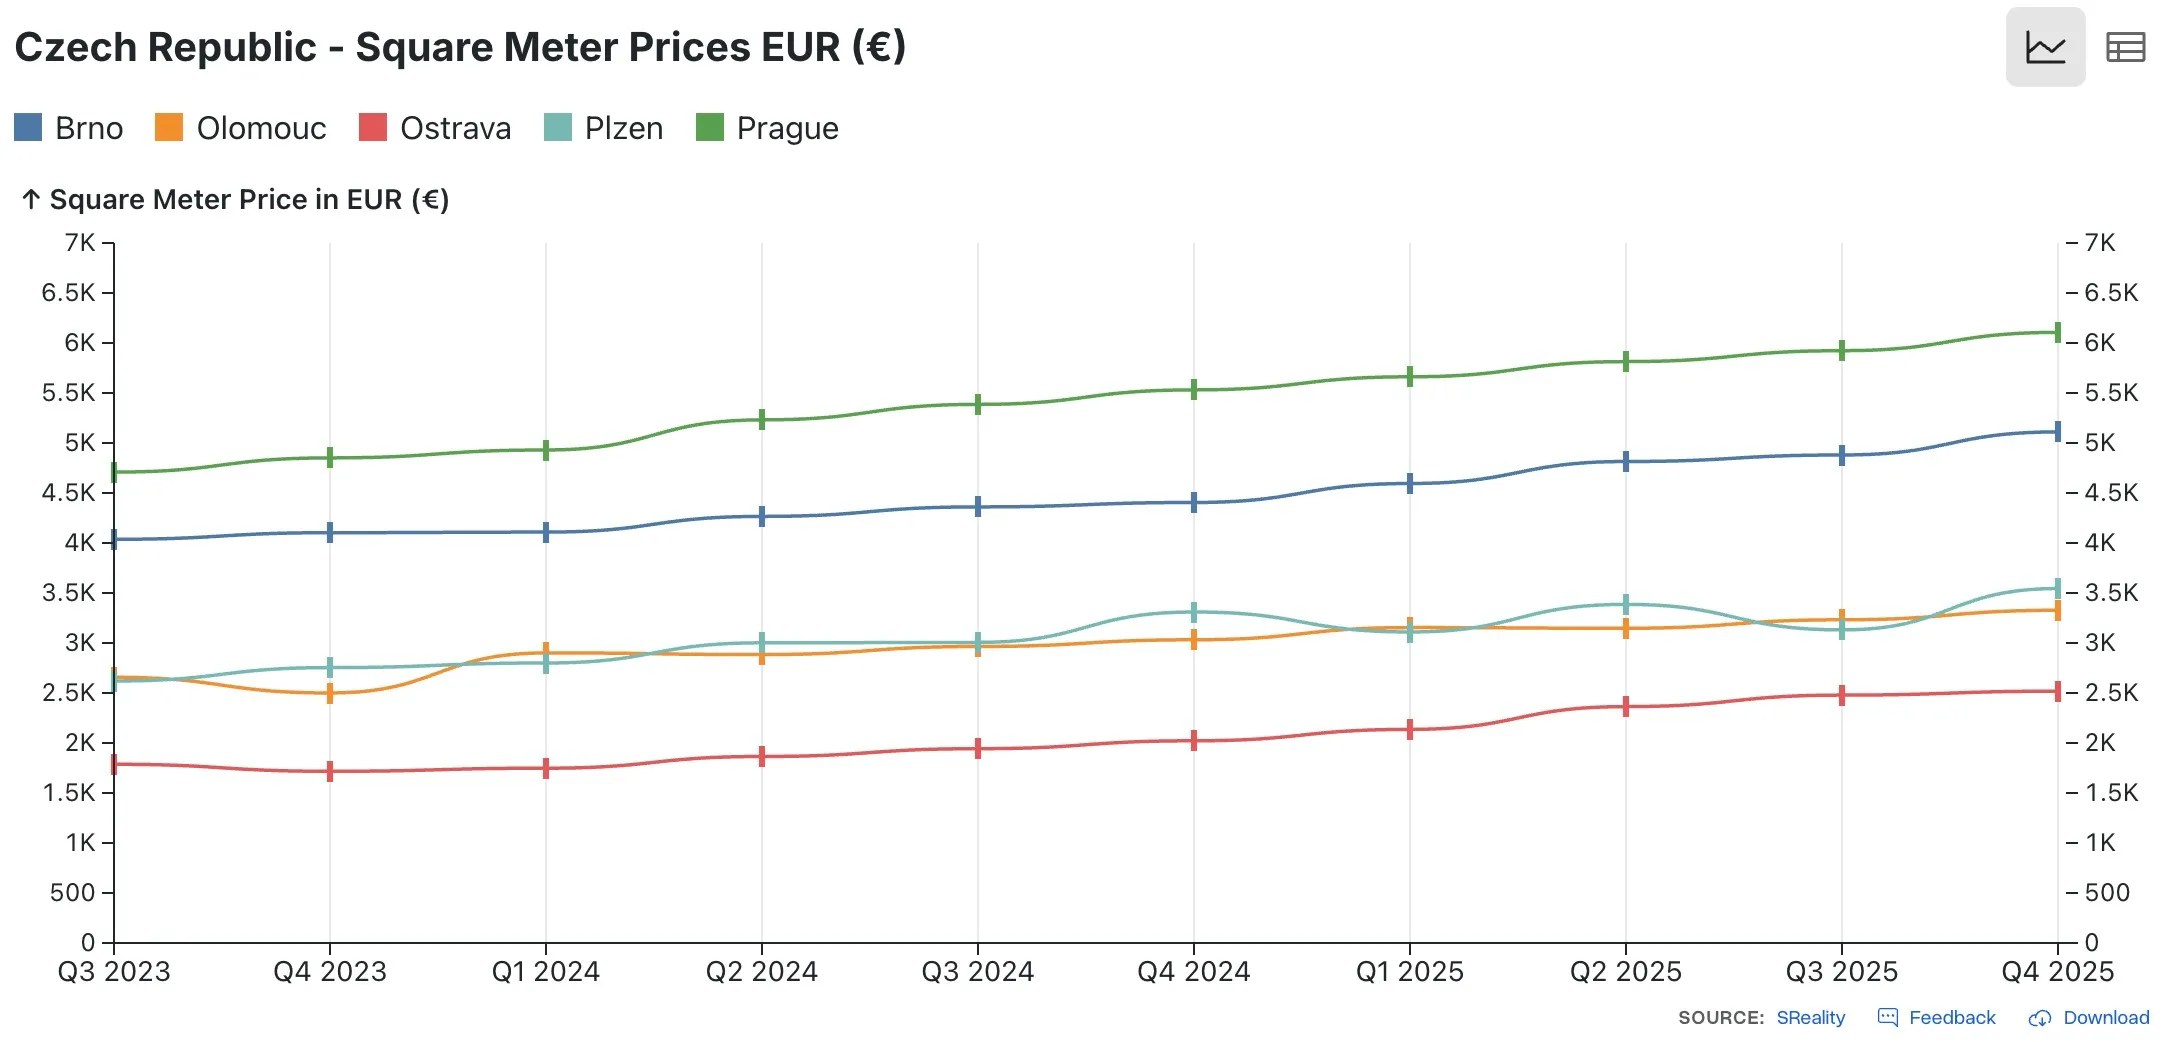
Embeddable chart component
Results and Impact
The solution delivered on all three goals. Charts displayed current data automatically, with no manual updates needed. No server processing meant no impact on their website performance or hosting costs, even as traffic grew.
Their users could access charts anywhere on the site, embedded in articles, dashboard pages, or promotional sections. All charts automatically reflected the latest spreadsheet data. When my client updated the source spreadsheet, changes appeared across the entire site within seconds.
⚠️ Warning: Public spreadsheet scraping means your data is exposed. Never put sensitive information (passwords, API keys, private metrics) in a public Google Sheet used for chart scraping.
The Google Sheets integration eliminated duplicate data maintenance. My client managed one source; everything else synchronized automatically. This reduced human error and ensured consistency across all visualizations.
From a business perspective, the solution was remarkably cost-effective. No API subscriptions, no additional server resources, no complicated data pipelines. A lightweight JavaScript file did the entire job.
The flexibility of the approach opened unexpected possibilities. My client could build new country-specific charts by adding rows to the spreadsheet. New pages could embed charts with a two-line code snippet. What could have been a complex technical project became a straightforward, maintainable system.
Page performance remained excellent. Charts didn't slow down page loads because the data fetch happened asynchronously after the page rendered. Core Web Vitals stayed in the green, and their users experienced smooth interaction with the visualizations.
This project demonstrated an important principle: solving a problem creatively often beats paying for a premium solution. By choosing client-side scraping instead of server queries or paid APIs, I built a solution that was free, performant, and perfectly matched my client's needs.
The approach works for any situation where data lives in Google Sheets and needs to be displayed publicly. It helps businesses shift data management to spreadsheets, where non-technical stakeholders can work comfortably, while automatically populating visualizations across the web.
Related Posts
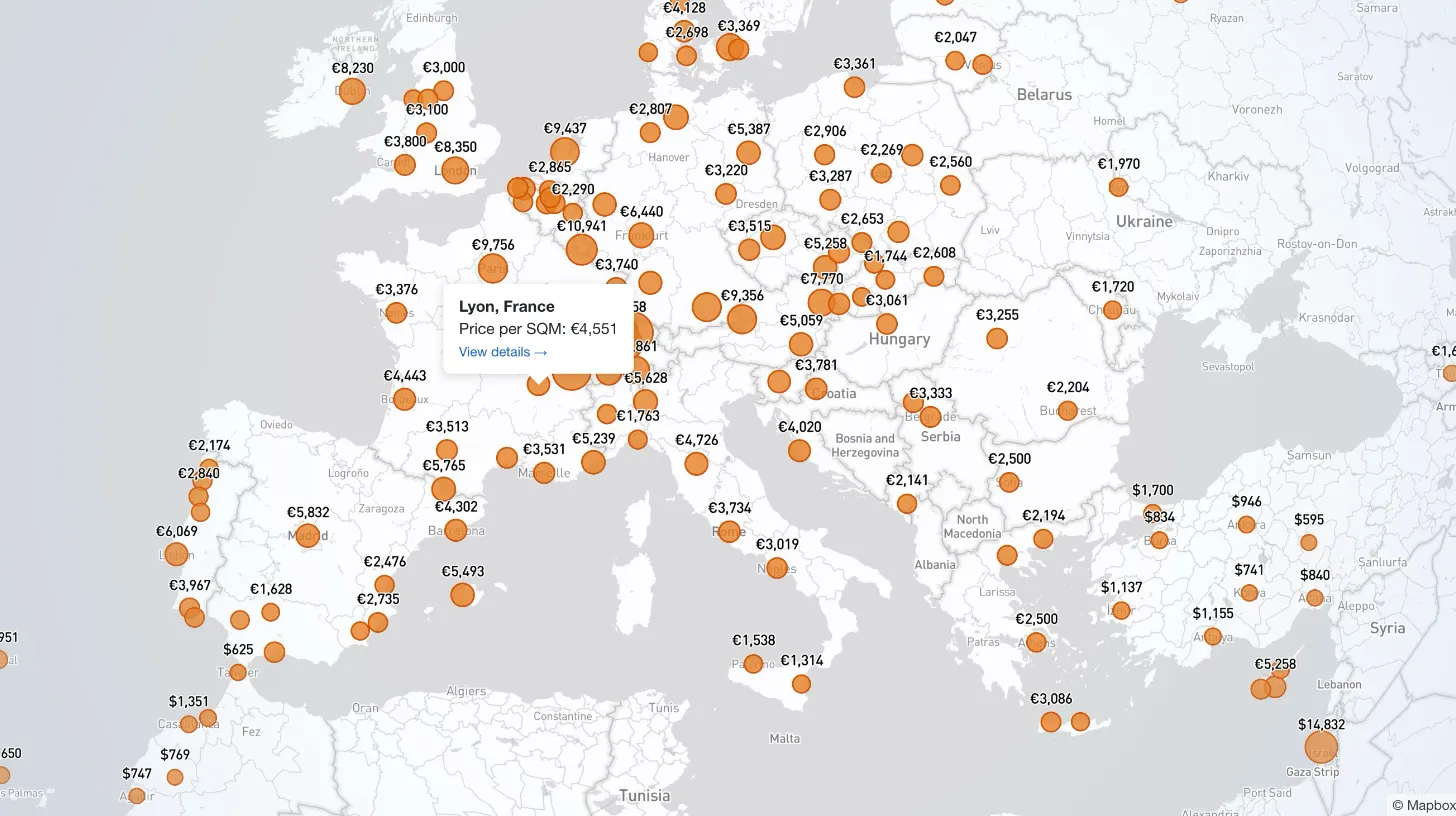
How I Built a Mapbox Globe for 38+ Real Estate Metrics
My client publishes real estate data for 80+ countries and wanted a single interactive view that could replace dozens of separate comparison tables. I built a Mapbox GL JS globe with 38+ switchable metrics, bubble and choropleth view modes, city drill-down, currency toggle, and pinned popups that deep-link into the country pages.
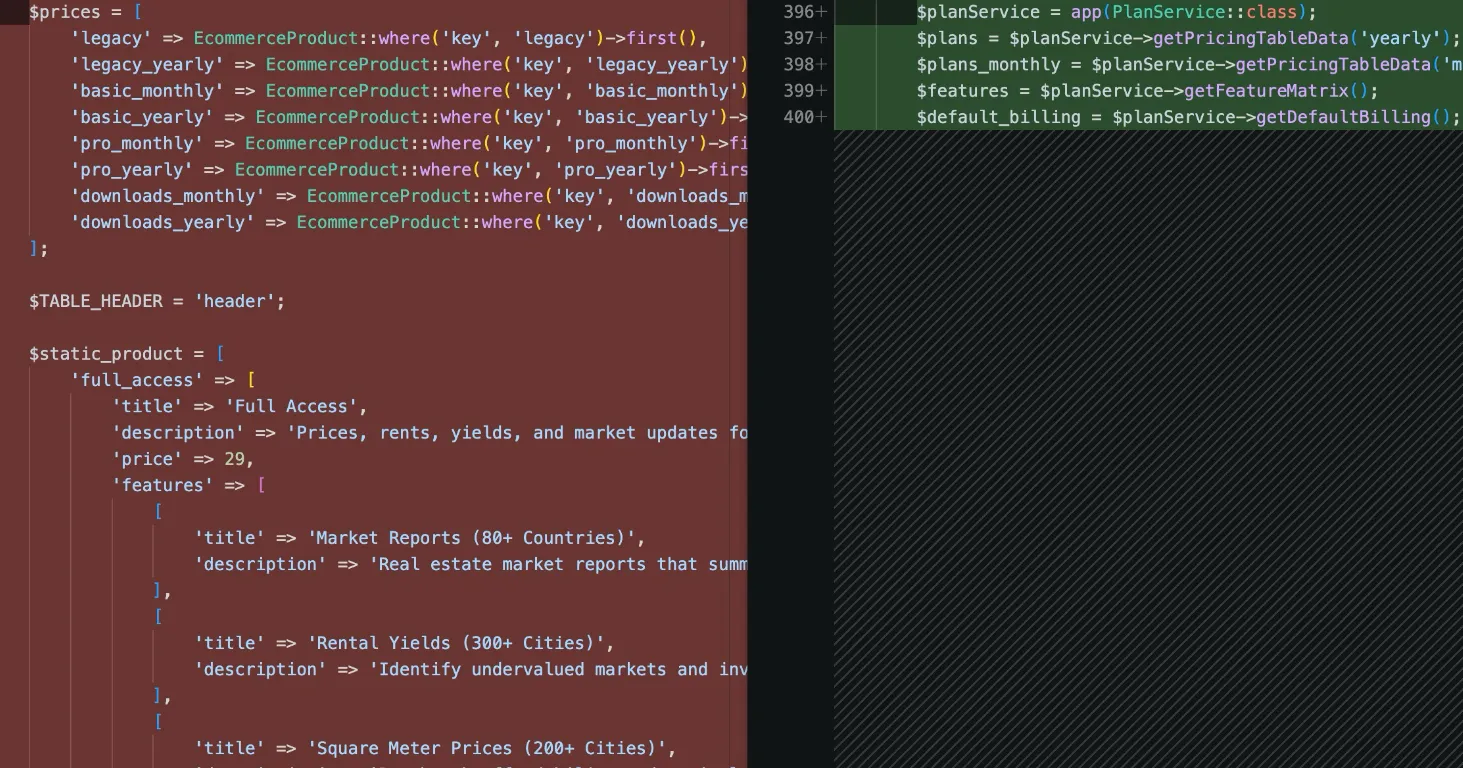
How I Refactored a Laravel Stripe Subscription and Deleted 4,628 Lines
Years of ever-changing client requirements had turned a Laravel subscription system into spaghetti code. Here is how I rebuilt it around a single config file and cut 4,628 lines.
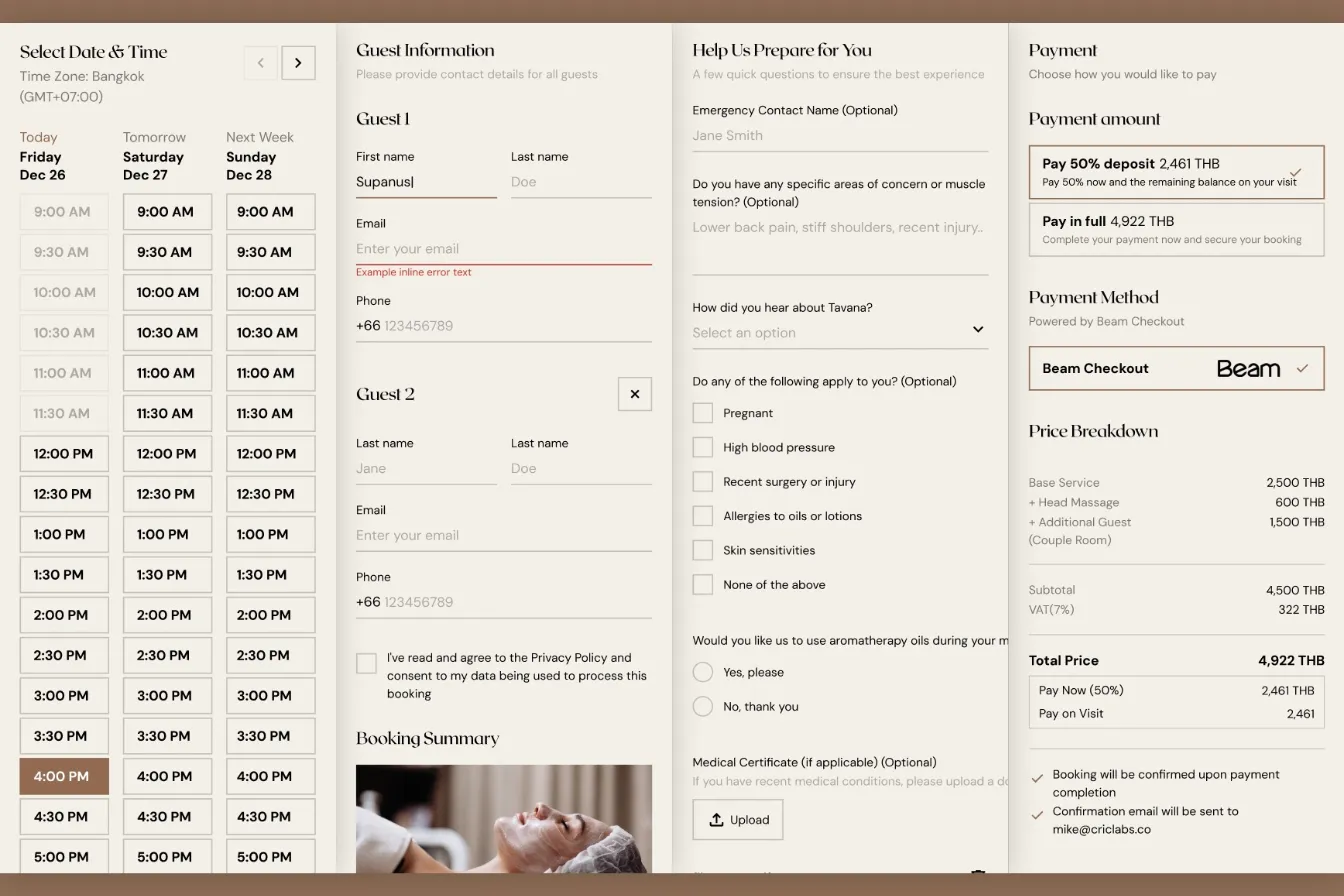
How I Built a Custom Webflow Booking System with Acuity and Beam APIs
I was hired by a software agency as a JavaScript specialist to build a booking system for their client who runs a luxury spa in Bangkok. Bridging Acuity Scheduling API and Beam Checkout API.

Law Firm Redesign: Simplification Without Sacrificing Performance
After initial success with a custom WordPress build, the law firm's homepage had grown unwieldy. We refined the design, removed visual clutter, and improved scannability while maintaining the performance gains.