How I Built a Mapbox Globe for 38+ Real Estate Metrics
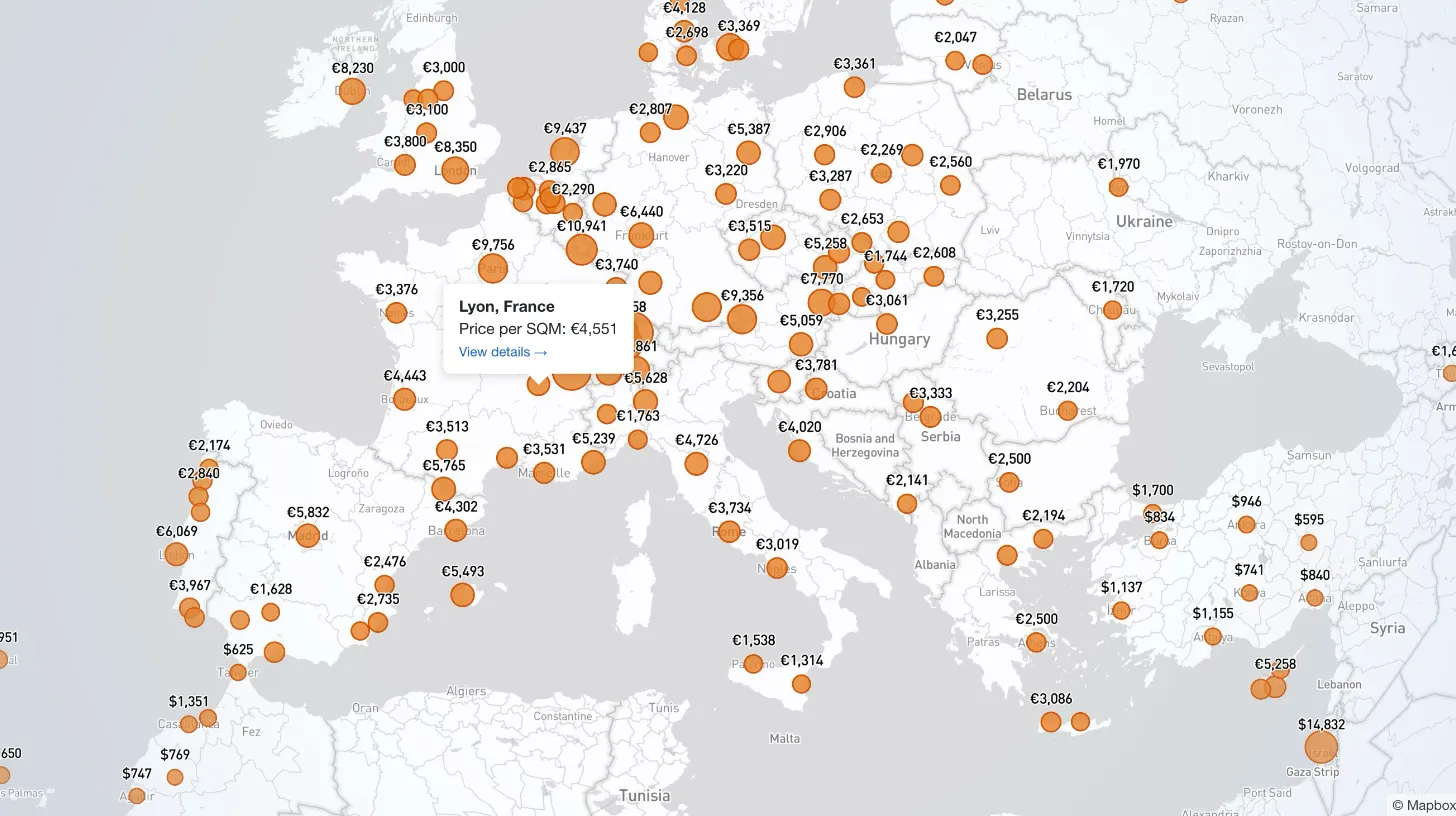
My client publishes real estate data for 80+ countries and wanted a single interactive view that could replace dozens of separate comparison tables. I built a Mapbox GL JS globe with 38+ switchable metrics, bubble and choropleth view modes, city drill-down, currency toggle, and pinned popups that deep-link into the country pages.
My client publishes real estate investment data for 80-plus countries. Buyers want to compare markets across countries and cities — square-meter prices, rental yields, house-price index changes, mortgage rates, round-trip transaction costs. The site already had dozens of separate comparison tables, one per metric, and users were asked to navigate between them. I built a single Mapbox GL JS real estate globe at /world-map that brings all 38-plus metrics into one interactive view, with drill-down into cities, a currency toggle, and pinned popups that deep-link into the full country pages.
This post walks through the design decisions behind the feature, the Laravel-backed data pipeline it sits on, and one small Mapbox state gotcha that almost shipped broken.
Key Takeaway
When a data site has "a page per metric" sprawl, a map with switchable metrics is often a better answer than a bigger table. The map communicates two things at once — geography and magnitude — and it lets users form questions ("which European countries have the highest yields?") that static tables make them reconstruct by hand.
The Problem I Was Solving
The site had rich data and no unified way to explore it. A user who wanted to compare square-meter prices across Southeast Asia had to open the square-meter prices page. A user who wanted to compare rental yields had to open the yields page. A user who wanted to look at both had to open two tabs. Country-to-country comparison was possible but awkward. City-level data existed for some metrics but was buried inside country pages.
The brief for the world map was that it had to:
- Render any of 38-plus different metrics on a single interface.
- Handle both country-level metrics (HPI change, mortgage rates) and city-level metrics (square-meter prices where city granularity exists).
- Allow users to compare magnitudes visually without reading numbers.
- Deep-link from a country on the map back into that country's full data page on the site.
- Fall back gracefully when a metric has no data for a given country.
- Work inside the site's existing Laravel 5.1 application without requiring a frontend framework rewrite.
Two View Modes, Two Questions
The first real design decision was bubble versus choropleth. I shipped both, toggled by a radio control on the map.
Bubble mode sizes a circle at each country's centroid by the metric value. It answers the question, "how big is this?" Large circles signal high values, small circles signal low ones. Bubbles are also the only mode that makes sense for city-level metrics, where the data lives at points, not across country borders.
Choropleth mode fills each country's polygon with a color scaled to the metric value. It answers the question, "where is this?" Choropleth is better for metrics where geography is part of the story — you can see an entire region of Europe in dark red for low yields, or Asia split across a rental-cost gradient, without having to scan.
Most data visualization tutorials pick one or the other and defend it. For this site, users were genuinely asking both kinds of questions, and the same underlying data could answer both. Letting the user switch was cheaper than trying to decide for them.
City markers go one layer deeper. When a metric has city-level data, a toggle button reveals a city-marker layer on top of the country layer. City markers are off by default because they add visual noise on metrics that do not need them, and on continent-level views they overwhelm the country layer. Users opt in when they want drill-down.
The Data Pipeline
The map needs to be fast, and the data it renders is expensive to compute. The site aggregates time-series data across 80-plus countries and derives metrics on demand, so I could not hit the database on every map page load.
I built a single /api/world-map endpoint that returns { countries, cities } indexed by country name. The response is cached for 10 minutes via Laravel's Cache::remember(). Ten minutes is the right window because the underlying data updates on a quarterly cadence — aggressive caching is safe, and the compute cost of re-deriving every country's latest value for every metric on every request would be wasteful.
On the client side, gpgWorldMap.js is roughly 1,000 lines of focused JavaScript bundled with esbuild. It handles metric switching, the projection toggle between globe and Mercator, user-geolocation fly-to on first load, and the popup lifecycle. The file is plain ES modules — no framework, no state library, no SPA scaffolding. It is loaded by a Blade view that also renders the Bootstrap 5 control bar above the map.
For the city layer to work, I needed latitude and longitude on every city in the database. The ts_locations table that holds the site's 80-plus countries and their cities did not have coordinates. Adding them manually for hundreds of cities was not going to happen.
I added latitude and longitude columns and wired up a geocoding button in the Filament admin CMS. When an admin clicks it on a location, Laravel calls OpenStreetMap's Nominatim API, extracts the coordinates from the response, and writes them back to the row. Nominatim is rate-limited and not appropriate for a live user-facing flow, but it is perfect for a one-shot admin-initiated geocode. The admin becomes the rate-limiter.
Pro Tip
When you need to geocode a few hundred records once and basically never again, do not build a production geocoding integration. Put a button in the admin that hits Nominatim per record, handle the errors inline, and move on. Anything heavier is overengineering for a job that runs exactly once in the life of the project.
DOM-Based Popups and Deep Links
The popup that appears when a user clicks a country is the handoff from the map back into the site. It has to do three things: identify the country, show the current metric's value, and link to the full country data page.
Mapbox lets you pass an HTML string to a popup, and for a minimum-viable version that works. It does not scale. As soon as you want event listeners, conditional rendering, or links that respect the app's client-side navigation, you end up concatenating HTML strings and losing any useful tooling. I built popups as DOM nodes instead — a small function that creates a container, appends a heading, a value line, and an anchor tag, and hands the node to Mapbox. The anchor is a real <a> element with an href pointing at the country's page on the site, so browsers treat it like any other link (new-tab, middle-click, screen-reader friendly).
Popups pin when a country is clicked, rather than closing on mouseout. Pinned popups feel more like part of the page than transient tooltips, and the deep link inside them stays reachable long enough to actually click.
The Mapbox State Gotcha
The map almost shipped with a bug that had cost me a couple of hours to diagnose. It is worth calling out because it is a pattern that shows up in most Mapbox GL JS apps eventually.
When a user switched from a country-level metric (say, HPI change) to a city-only metric (say, square-meter prices), the city bubble layer would come up empty. The data was there. The map just was not showing it.
The cause was execution order. When a country-level metric was active, my code set an internal citiesVisible flag to false so the city layer stayed hidden. When the user switched to a city-only metric, the data-loading path checked if (hasCityData && citiesVisible) before the branch that was supposed to reset citiesVisible back to true. By the time the reset ran, setData() had already been called on an empty source.
The fix was to hoist the "is this a city-only metric" check above the data-loading block entirely. Force citiesVisible = true and update the toggle button's active state before setData() runs. Same commit, I also disabled the choropleth view radio for city-only metrics, since you cannot render a choropleth from point data — the button gets pointer-events: none and 0.3 opacity so users see that the mode is unavailable rather than clicking it and getting nothing.
Warning
With Mapbox GL JS, any time you change both a source's data and a layer's visibility in the same code path, check the order carefully. Setting
setData()on an empty source before flipping visibility will leave you with a blank layer even after the data arrives. It is a quiet bug — no error, no warning, just nothing rendered.
Currency Toggle and Projection Toggle
Two smaller features rounded out the feature set.
EUR/USD toggle — The site's audience is global, and "is 5,000 per square meter cheap or expensive?" depends on the currency. I added a toggle that swaps all monetary metrics between EUR and USD in place, without a page reload. The API returns values in both currencies, the client-side module swaps which field it reads from, and the legend and popups re-render. This was one of the lowest-effort, highest-feedback additions on the whole feature.
Globe and Mercator toggle — Mapbox GL JS v3.19 renders a proper 3D globe by default, and it looks great, but Mercator is a more familiar projection for users who want a flat world to scan. A toggle between the two respects user preference and costs almost nothing to implement on top of Mapbox's projection API.
Results
One page now replaces dozens of separate comparison tables. A user lands on /world-map, picks a metric, picks a view mode, optionally turns on city markers, and explores. Clicking a country pins a popup with the current value and a link straight into that country's dedicated data page.
The bubble-versus-choropleth toggle turned out to be genuinely used in both modes. Users who want to compare specific values gravitate to bubble. Users who want to see regional patterns gravitate to choropleth. Offering both let the same underlying data answer two different kinds of questions.
City drill-down unlocked exploration that the site could not support before. Metrics like square-meter prices, which have meaningful variation within a single country, can now be compared city-to-city without leaving the map.
Key Takeaway
The map is the part users see. The part I am proudest of is how much the feature did not require. No frontend framework. No SPA rewrite. No dedicated geocoding service. One Laravel controller, one cached API endpoint, one Blade view, and one focused JavaScript module. The Filament admin grew a geocoding button that the client clicks a handful of times a year. The database grew two columns. That is the footprint.
When a feature brief reads like it needs a separate app, it is worth asking what the smallest honest version looks like first. Most of the time the answer is a single endpoint, a single view, and a narrower piece of JavaScript than you expected. The rest is design decisions about what the feature should do — which view mode answers which question, which layer is on by default, where a popup should link to — and those are the decisions that actually determine whether users will find the feature useful.
Related Posts
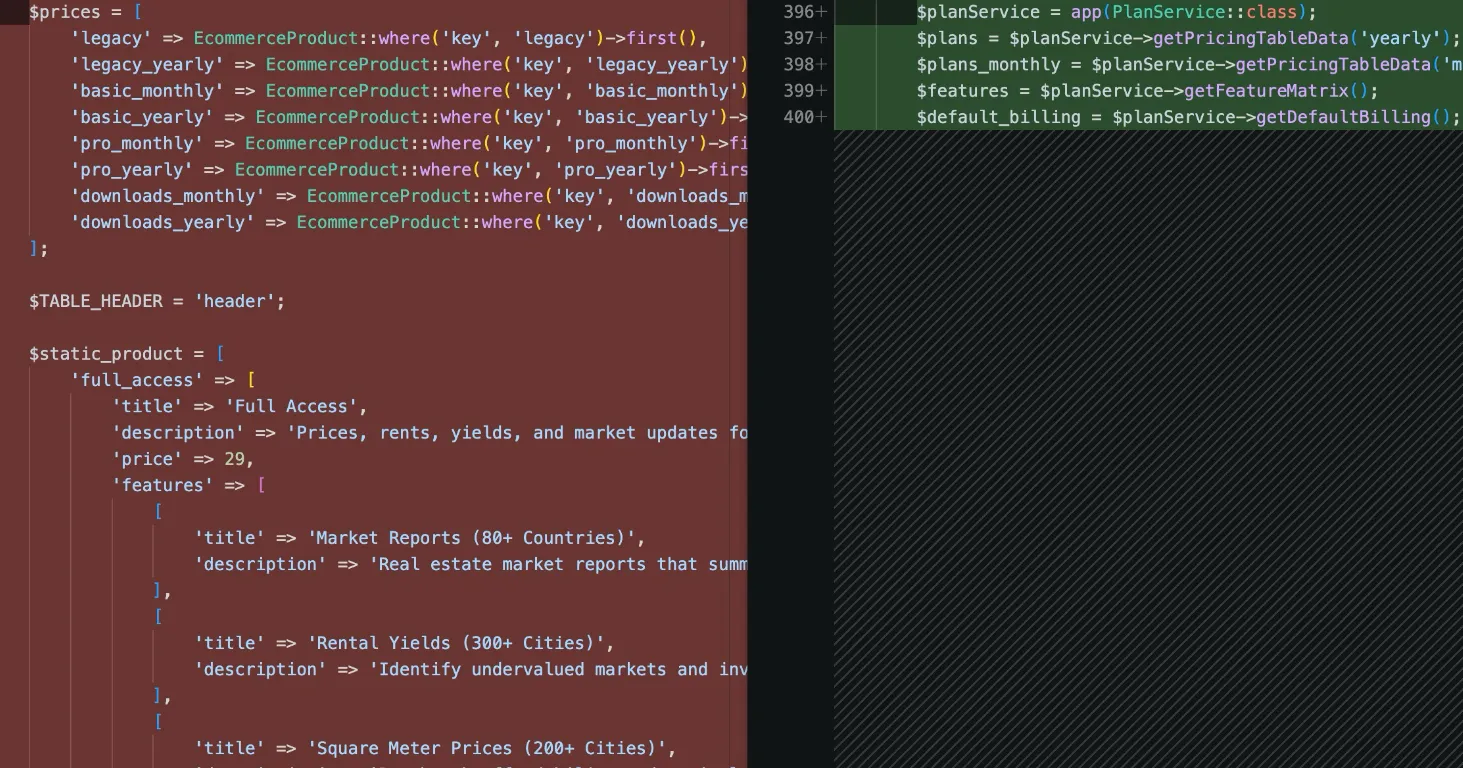
How I Refactored a Laravel Stripe Subscription and Deleted 4,628 Lines
Years of ever-changing client requirements had turned a Laravel subscription system into spaghetti code. Here is how I rebuilt it around a single config file and cut 4,628 lines.
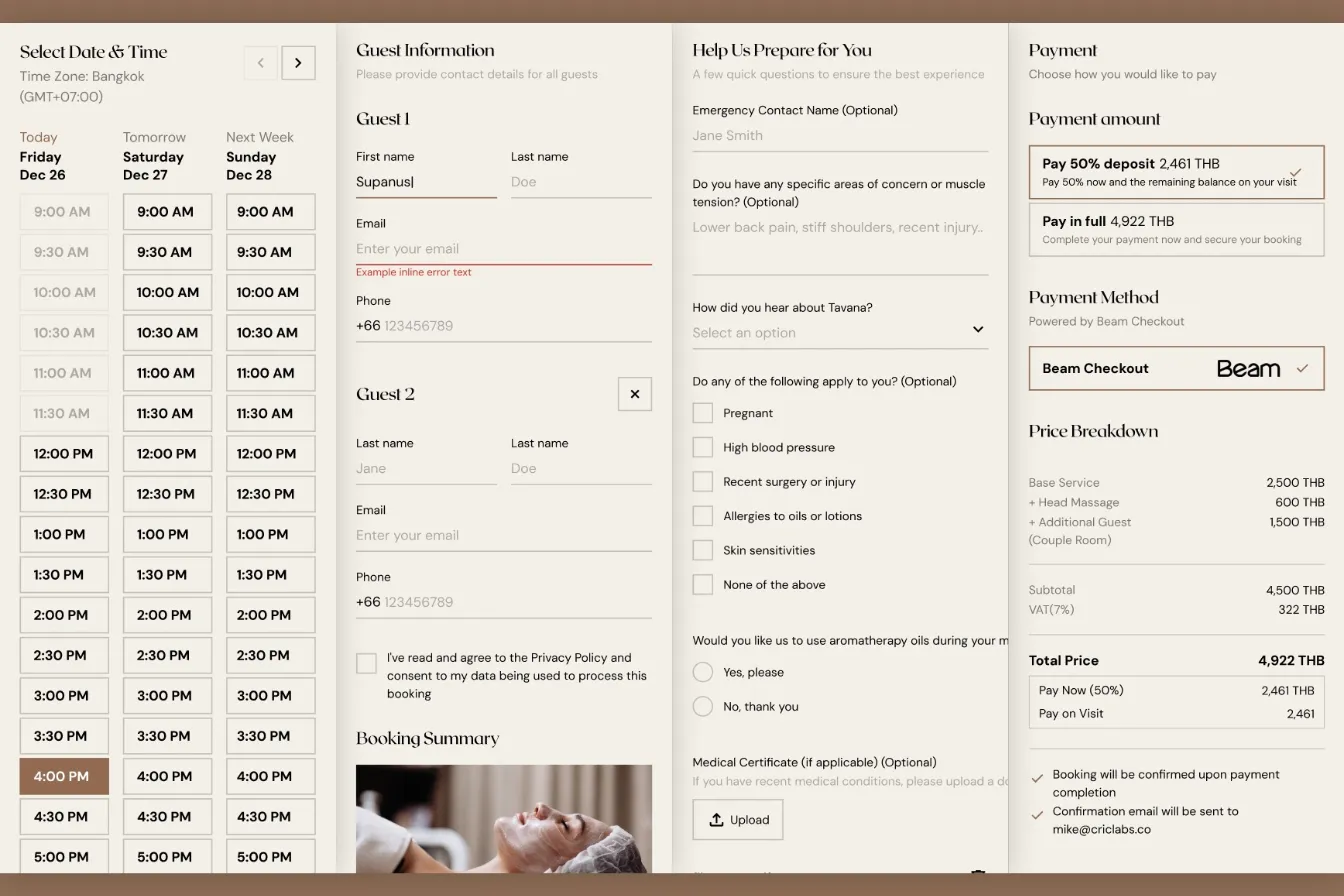
How I Built a Custom Webflow Booking System with Acuity and Beam APIs
I was hired by a software agency as a JavaScript specialist to build a booking system for their client who runs a luxury spa in Bangkok. Bridging Acuity Scheduling API and Beam Checkout API.
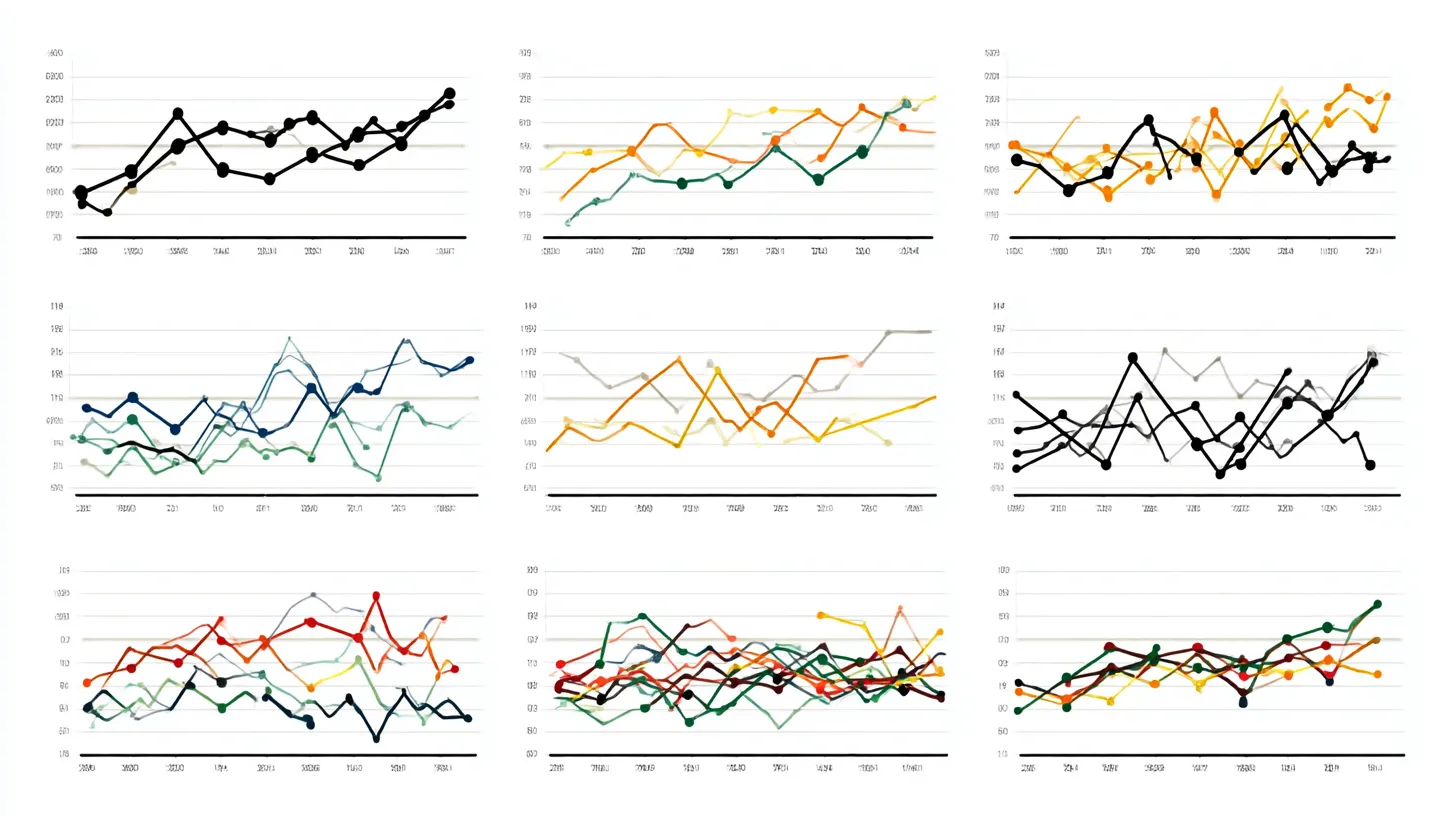
Building Real-Time Charts from Google Sheets: My Client-Side Scraping Approach
My client needed interactive, country-specific data charts embedded across their site. Rather than querying the server or paying for APIs, I built a client-side scraper to fetch data directly from Google Sheets in real-time.

Law Firm Redesign: Simplification Without Sacrificing Performance
After initial success with a custom WordPress build, the law firm's homepage had grown unwieldy. We refined the design, removed visual clutter, and improved scannability while maintaining the performance gains.